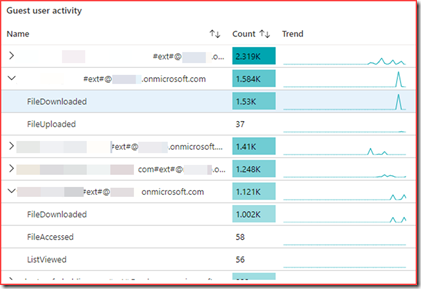
There are many different visualizations in Azure Workbooks. A grid can be just a plain grid, or a grid with a parent/child relationship, or grouped by values in columns. This post will show you how to build the grid with a parent/child relationship. We want to group guest user activity for this scenario. We will be needing OfficeActivity logs to get the activity from guest users.
Setting up the Azure Workbook query
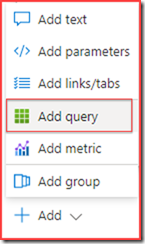
Build your own workbook and add a new query
Add query
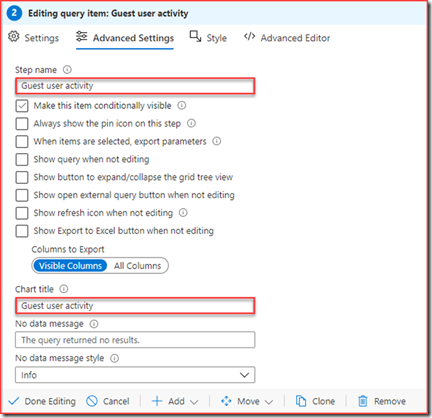
Give it a name and go to settings
Fill in the query (you can copy/paste the JSON representation of this item below).
Query breakdown
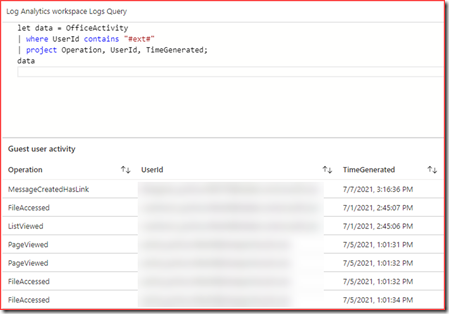
First get the required information and place them in a variable
This will get all Office Activity where the UserID contains #ext# and we only need the operation, UserId and TimeGenerated.
Note that you need to end with “;”
Running only this will get us the below output.
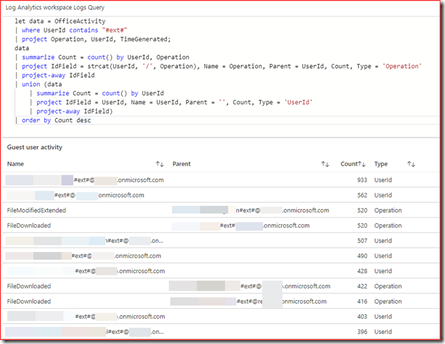
The next bit will map the parent with the child.
First we project the columns IdField, Name, Parent, Count and Type. IdField is a concatenation of UserId and Operation. Project-away is used to remove the IdField from the output.
We will add additional rows with the union operator. These will have the same columns but the IdField is only filled with the UserId. This column is also removed from the output.
The output will be ordered by Count
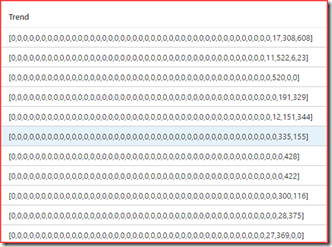
Next we will also want to add a trend line. We will be using the join operator for this. The join operator will merge the rows of two tables to form a new table by matching values of the specified columns from each table.
It will count the number of occurrences and place it in the Trend variable
Look and feel
Customize the column settings
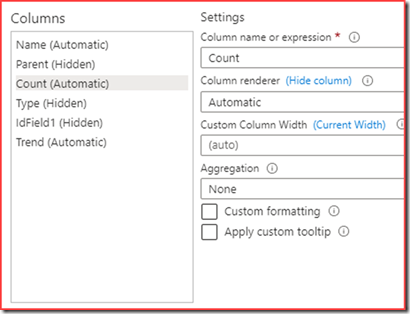
Hide Parent, Type and IdField and configure Count
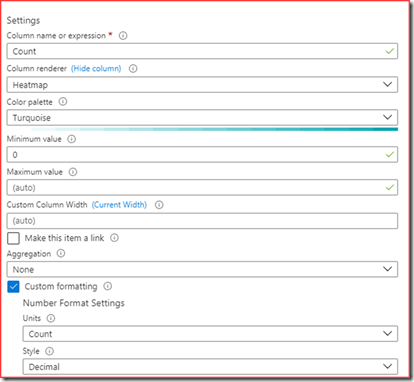
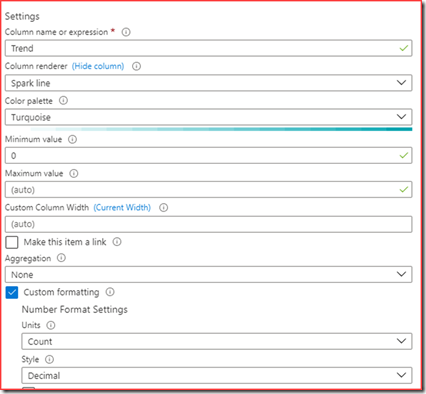
Create a Heatmap with the above settings. Next configure the Trend column
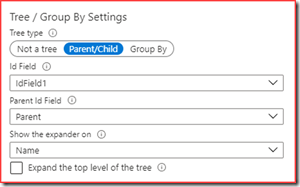
Also change like above and configure the Tree / Group By Settings like below
Apply and close which should change the look and feel to
JSON representation
You can copy and paste the below code in the advanced editor for a query.
{
  "type": 3,
  "content": {
    "version": "KqlItem/1.0",
    "query": "let data = OfficeActivity \r\n| where UserId contains \"#ext#\"\r\n| project Operation, UserId, TimeGenerated;\r\ndata\r\n| summarize Count = count() by UserId, Operation\r\n| project IdField = strcat(UserId, '/', Operation), Name = Operation, Parent = UserId, Count, Type = 'Operation'\r\n| join kind = inner (data\r\n                    | make-series Trend = count() default = 0 on TimeGenerated in range({TimeRange:start}, {TimeRange:end}, {TimeRange:grain}) by UserId, Operation\r\n                    | project IdField = strcat(UserId, '/', Operation), Trend\r\n                    ) on IdField\r\n| project-away IdField\r\n| union (data\r\n    | summarize Count = count() by UserId\r\n    | project IdField = UserId, Name = UserId, Parent = '', Count, Type = 'UserId'\r\n    | join kind = inner (data\r\n                        | make-series Trend = count() default = 0 on TimeGenerated in range({TimeRange:start}, {TimeRange:end}, {TimeRange:grain}) by UserId\r\n                        | project IdField = UserId, Trend\r\n                        ) on IdField\r\n    | project-away IdField)\r\n| order by Count desc",
    "size": 0,
    "title": "Guest user activity",
    "timeContext": {
      "durationMs": 2592000000
    },
    "queryType": 0,
    "resourceType": "microsoft.operationalinsights/workspaces",
    "visualization": "table",
    "gridSettings": {
      "formatters": [
        {
          "columnMatch": "Parent",
          "formatter": 5
        },
        {
          "columnMatch": "Count",
          "formatter": 8,
          "formatOptions": {
            "min": 0,
            "palette": "turquoise"
          },
          "numberFormat": {
            "unit": 17,
            "options": {
              "style": "decimal"
            }
          }
        },
        {
          "columnMatch": "Type",
          "formatter": 5
        },
        {
          "columnMatch": "IdField1",
          "formatter": 5
        },
        {
          "columnMatch": "Trend",
          "formatter": 9,
          "formatOptions": {
            "min": 0,
            "palette": "turquoise"
          },
          "numberFormat": {
            "unit": 17,
            "options": {
              "style": "decimal"
            }
          }
        }
      ],
      "hierarchySettings": {
        "idColumn": "IdField1",
        "parentColumn": "Parent",
        "treeType": 0,
        "expanderColumn": "Name"
      }
    }
  },
  "name": "Guest user activity"
}
